Since the beginning of the year there has been significant turmoil in the financial markets. The Standard and Poor’s 500 Index (S&P500), dropped approximately 23% in mid-March of 2020 and then quickly surged back just short of prices prior to March 2020. This is a very high-level of volatility for the stock market. This article uses the S&P500 as a general gauge of overall stock conditions and provide context. The goal of this article is to discuss ways to view market risk with three real-life examples. For this article, the terms “trader” and “investor” will be used interchangeably as will “stock” and “equity.”
This article will discuss the following topics.
- A brief history of recent stock performance
- Three examples of extreme volatility (a) Hertz car company stock price while in bankruptcy, (b) large volatility in an oil futures contract (c) and the “Flash Crash” of 2010.
- General views regarding how investors can approach and view risk
- Some basic finance statistics, accounting and economics to help reinforce the real-world examples
Brief in Market Trends:
With the advent of online trading in the 1990s the “internet/tech bubble,” formed and subsequently deflated, this was partly pushed by retail investors trading at home using the internet. Shortly thereafter, high-speed, and then high-frequency trading (HFT), became popular. Programmatic trading hubs surfaced where many people did not trade themselves but traded through programs with specific rules they created. As this occurred, two things happened:
Dark Pools
Dark pools are private exchanges that are not accessible to the individual investor. They are run by large banks and other institutions. Dark pools are not new, but with new technology the mechanics have changed significantly from their role in the past. For a quick primer on dark pools here is a link to what Investopedia has to offer.
In addition, the author recently finished a book called “Dark Pools” by Scott Patterson which traced the history of high frequency trading and illuminated a lot on the topic of dark Pools. This book is highly recommended for those that wish to illuminate this area of the markets.
New Trade Order Types
New trade order types were created by the National Association of Security Dealers Automatic Quotation (NASDAQ). There are market orders an individual can use when trading on their account such as limit orders that may be beneficial depending on your strategy. However, these new order types were more complex and advantageous to high-frequency program traders. These were complicated orders with statements like “if” and “or” in them, many of these sought to take advantage of arbitrage opportunities through speed and information related to pricing. for orders that were queued on exchanges but not yet executed. The orders looked more like the logic one maps out before they write a computer program. Over the years the term arbitrage has taken on many more assumptions and a wider breadth. At its core arbitrage means riskless profit. However, the term frequently means “almost” risk free profit. NASDAQ’s goal during this time was to gain market share in their business of servicing more trades. This was very evident as shown by extreme competition with the New York Stock Exchange (NYSE).
In the current market environment, there has been a significant increase in retail trading by individuals that do not normally trade frequently and previously parked more or most of their excess earnings in mutual funds, index funds and retirement accounts. In all cases, the investor does not actively trade individual securities but purchases the services of a professional or invests with the diversification of an Exchange Traded Fund (ETF). Today, individuals are managing significant amounts of individual name stocks for themselves.
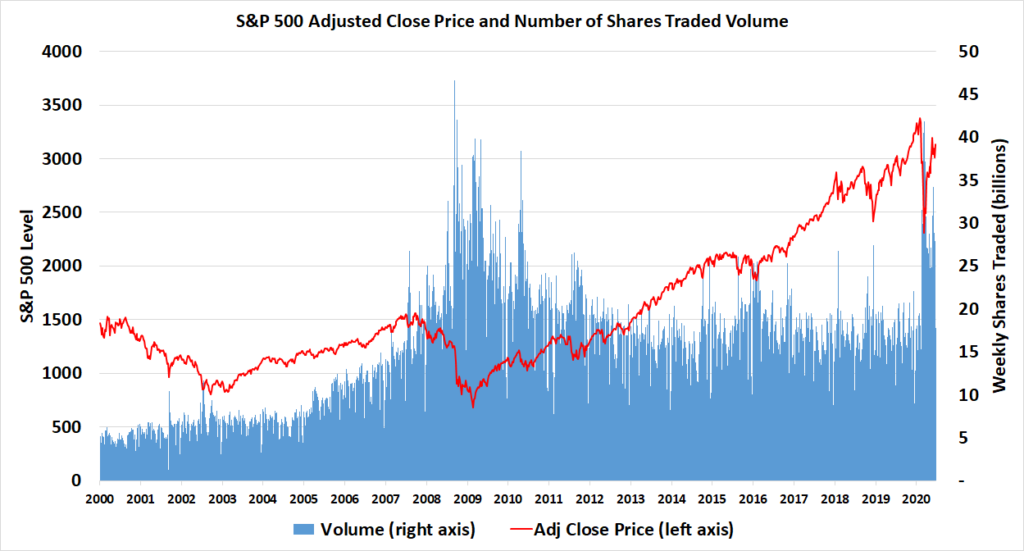
The internet now provides a wealth of information on individual companies. There are also specific stocks that gain popularity through constant news feeds and ever pervasive social media. The advent of free online trades, a low interest rate environment, the lack of sports gambling combined with general boredom are all reasons more individual investors are testing their luck trading. The graph below shows the S&P500 price index as well as the volume of shares traded for the 500 stocks in the S&P 500.
There has also been a significant increase in volatility. Below are some observations that may serve useful for retail investors. They serve as a warning that the markets are currently very volatile and hint that there may be significant speculation. Whether this precludes a bubble out of the scope of this article. A future article will cover some time-tested metrics that show fundamentals in relation to current market prices.
Below are three cases for study. While reading this try to play a game called “where is the risk,” as well as “what do others know that I do not know.”
(1) Hertz Company Stock Performance in 2020: Ticker (HTZ)
Hertz is considered the first rental car company in the United States. It started with a fleet of twelve Model T’s in 1918. At that point in time it was known as “Rent-A-Car Inc.” The most recent few decades have seen strategy changes, acquisitions, and a significant amount of debt added to the company. On May 22, 2020 Hertz filed for bankruptcy.
Hertz filed what is known as chapter 11 bankruptcy. Chapter 11 bankruptcy is not a liquidation, that is chapter 7 bankruptcy. In chapter 11 bankruptcy, the company hopes to trim its capital structure (less bonds in most cases), usually converting its old debt (bonds) to new equity. It is almost never good for current stockholders. The goal is to lower interest payments that the company was previously obligated to pay. In bankruptcy, some newly issued bonds help with financing, some old bonds become equity and typically old equity becomes worthless. It often also includes shedding underperforming assets such as factories and service locations and/or raising funds by selling business units or other balance sheet assets.
The Hertz ride has been interesting. At the time of this writing (July 9, 2020), Hertz is currently trading at $1.50 a share. This suggests the market values the entire equity portion of the company at around $200 million as it currently stands amid the bankruptcy process. There is an exceptionally good chance that this value will be rendered worthless based on bankruptcy court petitions and legal judgments. What is concerning is that the stock price briefly jumped to over $5.50 a share on June 18, 2020. This means that after declaring bankruptcy and hitting a low of around $.80 a share, the stock price briefly suggested the outstanding company stock was worth almost $800 million. This is quite the unexpected performance for a stock in bankruptcy.
The most likely culprit is highly speculative individual investors and perhaps some big money such as hedge funds or other large investors. While in bankruptcy, Hertz decided to sell substantial number of used cars which may raise cash for the company. See Python Programming and Used Cars, which uses the Python programming language to analyze Hertz’s for sale car portfolio. An opportunistic Hertz even tried to issue new equity, pre-judgment, while in bankruptcy to capitalize on the rise in stock price, but was stopped by the United States Securities Exchange Commission, (SEC). This would have diluted current outstanding shares.
Lesson
Depending on their timing, some investors made money on Hertz while others lost money. In this situation, an investor’s owns psychology may cause them to believe they missed out. When this feeling enters an investors mindset, they may make irrational and uncharacteristic decisions to try to make a quick profit.
Even professional hedge fund managers, mutual fund managers and other in-house fund managers often stray from their investment thesis when these types of thoughts enter their mindset. A good investor will have a “break the glass” protocol in place that requires analysis, discussion, and decisions before considering a break the glass event and a change in their previous long-term strategy. Moreover, some funds even have a break the glass event and protocol in place, prior to the breaking the final glass event protocol. That is two layers of glass, each with thought out requirements prior to making a strategy change. The rules are put in place because a good investor recognizes they are human. They are a guard against the investor’s psychology and themselves when their feelings attempt to override the trading strategy.
Strategy does change over time. An investor does need to know when to change their position and there are valid reasons based on information, research, and new events. When this change of strategy occurs, it must be based on underlying changes in the investors overall financial position, investor holdings and the respective market conditions. Individual investors must do their best to create their own protocol before they break their own glass. It is recommended that this be written and followed closely. Investors must make a system where change is acceptable but only if certain criteria are met. For many investors change is not good because it happens to frequently. In your individual strategy, keep aware of the following two notes, they apply to more than just publicly traded stock and even extend beyond your investments decision-making and into other aspects of your life.
- Individuals Have Less Information: Professionals have access to resources and spend every day in the market in which they trade. Resources include operational teams, unique technology, expensive subscriptions, and internal research reports. There are also investors such as Warren Buffet. A good biography about Buffet is “The Making of an American Capitalist” by Roger Lowenstein. The author highly recommends this book. However, if the reader believes Warren Buffet is simply a shrewd investor, think twice, he has many people around the world he can call for information to “check” on ideas. He also has more timely information than many individuals. His network effect with those in which he does business gives him information related to company plans for acquisitions, stock sales, and other offerings. Individuals do not get most this information until it is publicly available.
- Individuals Lack Speed: Now more than ever, due to high frequency trading and technology, individuals are at a disadvantage regarding speed of execution. Many trading platforms make order information available to buyers when an order is placed before it is even executed. This allows other traders to move in and out of the stock ahead of your execution, they see a buyer or seller with their price order and they move in and out quickly, adding and cancelling trade types that most individuals are not familiar with. This is all to shave off a few cents, or fractions of a cent on thousands of shares. This can result in those players making a profit while giving the individual a subpar execution price. Of course, this is all in the name of “liquidity,” they say, but how much liquidity is enough? A good read on this topic is “Flash Boys,” by Michael Lewis.
Because of the above two items, individual investors must work to (a) pick their battles when it comes to investments, (b) play to their advantages, and (c) be careful with their own psychology. If the reader has a pulse on the computer gaming market stick to that, if you are a doctor and see opportunity in a new medicine perhaps you have an edge there, if you really like a new product and see all your early-adopter friends purchasing that product, use that information when making decisions. Remember to be creative and use guerilla tactics. The author has sat in parking lots to gauge store traffic and called shoe stores to gauge inventory. These are two things an individual can do. There is one last point. Never forget, most of us will do quite alright with a diversified portfolio using retirement accounts, mutual funds, or exchange traded funds (ETFs).
(2) Oil Futures in 2020
The commodities market is a place with rapid price changes and is not for the faint of heart. The market is driven by both supply and demand and of course momentum and technical traders. For those interested, the classic movie “Trading Places,” may be an interesting watch. Most people that trade in commodities do not really want to physically buy a truck load of oranges, pork bellies and much less a barrel of unrefined oil. They would rather hedge business risk or speculate the price of those physical goods. There are of course large companies that use the above-mentioned raw materials in their business and do need the commodity. However, this author would not know how to approach ten tons of oranges, five thousand pork bellies, or a tanker of oil at their doorstep.
The commodity market trades in what are called futures, which are priced based on the expected future price of a commodity. This could be the oil price one month or six months from now. Most importantly there is a specific settlement date. At the settlement date of the futures contract, the owner of the futures contract needs to either take the actual physical delivery of the commodity or deliver the actual commodity to another party on the other end of their trade.
If the price of a purchased oil future rises significantly in the future, an investor has made either a wise or lucky investment. A short position is used when an individual thinks a price will be lower in the future when the contract reaches settlement. Many trading platforms also allow traders to settle in cash using baskets of futures or even assets that simply mimic futures. In this case the investor does not need to ever consider receiving a physical good. Below is an example of a specific oil futures contract.
Prices for the NYMEX West Texas Intermediate (WTI) crude oil are published by the Chicago Mercantile Exchange (CME), group. This is an extremely popular contract to trade. West Texas Intermediate refers to the type of crude oil known as light, sweet crude.
Open up Oil Futures Contracts for a quick view of oil contracts from the CME website. This shows prices for various futures contracts that expire between August 2020 and February 2031. These are all “active” futures as of today’s date, July 9th, 2020. The dates for available futures will change with time based on when this article is read. With a quick glance the reader will notice that these prices are available for contracts that reach settlement as far out as 2031. Outside of price spikes, futures prices typically trend slightly up in the future and sometimes slightly downward.
Here is an example of what has recently transpired in this specific oil futures contract. This Futures Page is a weekly historical chart of WTI futures prices located at . Load the page and then set the chart to weekly pricing starting on January 2020. Here are weekly historic prices for the futures contract that closes in August 2020 as well as the current price. Now pause, review the table in the link, and read the previous four sentences again. Many people often get confused when they first look at commodity futures because they do not realize that each future is a contract for a specific settlement date. There is an entire additional page for September, October, December, and all the other months many years into the future. At settlement in August, the trader would be delivering or accepting physical barrels. Looking at the history the price has been a little choppy at minimum. In January, this August dated contract traded at around $60 but a steep decline in price happened in March 2020 that bottomed at -$37.63 in April 2020. That alone shows how much this market can move in a short time. The reader may recall this is the same time we saw heavy downward movement in the S&P 500. This large of a drop is not typical and displays much more volatility than normal. This was also the first time this oil future traded at a negative price.
At the time many articles pointed to overproduction in oil as demand dropped due to less travel during this COVID-19 pandemic. As always, there were probably already other longer-term trends such as renewable energy and energy efficiency improvements etc. On the positive side, for large oil producers this was a good time to weed out players that have a higher cost to pump each barrel of oil. In this instance, there was simply nowhere to put it and future consumption at the time was fraught with uncertainty.
A negative price implies someone would pay you to take a future contract to accept physical oil at settlement. This created many technical problems for those in the oil futures market. On July 5th, 2020 the Wall Street Journal posted an article about a gentleman who bought oil futures at $.30 a barrel in April and then watched his position drop below zero. Not only did this 22-year-old gentleman think oil futures could not go negative, in this case his trading platform still showed positive prices and froze when he tried to exit the position as his losses mounted.
The culprit could have been as simple as negative sign that crashed a part of a program that could not accept anything that was not a positive number. Customers at E*Trade, TD Ameritrade and Interactive Brokers also were not able to make trades at negative prices. They could not close their positions and stop their losses as prices plummeted below zero. As it stands, it looks like these investors will be compensated for their losses from the technical error.
Lesson
Commodities have substantial volatility. One of the hardest things to gauge is the specific market for a good as well as what is going on in the production and demand environment. If an investor also considers currency risk and interest rate risk there is a lot with which to work. For these reasons it may be good for individuals to avoid this market. Below are two dangerous pitfalls that many investors can fall into. The second point is one that many investors may not be able to avoid.
Historic prices could not be trusted to serve as a low point for oil prices
People often get comfortable by saying something declarative based on historical price levels or percent changes in asset prices. Remember “housing prices will never go down.” This mindset can give a false sense of security to people when a new extreme event transpires. This also leaves investors in shock when a previous record price (whether it be a high or low), is broken. It does not take a huge mental leap to understand that if oil was pumped and there was no room in which to store that oil something had to happen. In this case physical oil became a liability that investors needed to get into someone else’s hands, not an asset. A well-made economic pricing model would be able to forecast negative prices in certain unusual situations. No economic foundations were broken here.
A technical shortcoming in programming
In this specific case we also saw a technical “glitch” occur. So even if an investor could have navigated the volatile pricing, they still had a technical trading problem. Locked trades, based on the programming of trading platforms, restricted investors from entering or exiting contracts when prices were negative.
As great as the current market structure seems to be, programmers of trading software still put hard boundaries on prices in their code in a way that reduces their flexibility. This may be a known limitation that is accepted based on history. This could also be due to restrictions from other programs that interact with their program or perhaps just not knowing the range of potential prices a program needs to be able to run on.
This author has personal experience in capital adequacy modeling for various banks in assets such as credit cards, whole loans, mortgages, and securitized products. Financial modelers sometimes do a similar thing to programmers. Models frequently use a variable to predict future values and often do not understand the range of that variable value. Statisticians may use transforms such as the square root of an interest rate spread as an independent variable. This can often result in aa better fit or better predictive power. The danger is this is often done without considering that the percentage value of that variable can go negative. Historical knowledge and economics need to be employed to perform a check on financial model variables. Here is a quick example. Pick up a calculator or use an Excel sheet to take the square root of negative two and review the output. Using the authors HP 12c financial calculator the output is, “Error 0.” If that a square root of a negative number was used in a model’s code, the model would print something similar or perhaps the word “undefined.” Anything downstream from that error would not calculate. The model would error out.
(3) The Flash Crash of 2010
For a final example consider the Flash Crash on May 6, 2010. The author was sitting at a Bloomberg Terminal as a member of a student run and faculty advised bond fund. For those that are not familiar with Bloomberg Terminals, they are widely accepted information machines that many institutional investors and traders use for analyzing their investments. As this author watched his Bloomberg screen The Dow Jones Industrial Average (DJIA), which tracks the thirty largest US stocks, dropped just shy of 1,000 points or about 9%, and it did this quickly. The screen was almost entirely red signifying a drop in many stock prices. This was the second biggest intraday decline for the Dow Jones Industrial Average after the 1987 crash known as “Black Monday.” It was as if the stock market was vanishing and it took 36 minutes until it stabilized. There really was no way to avoid this risk or determine what caused the precipitous decline and more specifically when it would have happened.
The trigger seems to have been an order from one trading firm in Kansas that set off high-frequency trading bots (program algorithms), or perhaps other trading programs into a sell strategy. At least that is the conclusion today. Whatever the trigger, stocks of eight major S&P 500 companies dropped to $.01 for a short period of time and these were well known stocks. These included names like Proctor & Gamble, Apple, and Accenture. Trades were cancelled or rolled back for those penny shares and investors were supposedly made whole.
Next is a brief but important statistical interlude. In statistics, distributions are mathematical functions that give the probabilities of an occurrence for different outcomes. So called “normal distributions,” are frequently used to describe the probability of events happening. There are other distributions, but “normal distributions” have frequently led to misplaced investments when they are a basis for financial models or more simply financial decisions. For context, academics have run likelihood events for historic S&P 500 price changes. Between the years 1900 and 2000 the S&P has more than once had swings that should occur every 7,000 years based on a normal distribution. The 7,000 comes from what are called large standard deviation events that should be extremely rare. Almost all possible events happen within a few standard distributions. Readers must to be conscious of the inputs to the models they are using for their investments and historic values in which they often place too much confidence.
Wall Street and the journalists that cover the capital markets are never short of exact reasons for why markets and individual assets move. Note: That is a paraphrase from the book “Business Adventures” by John Brooks. This is a worthwhile read. In the latter case there had been warnings of a potential crash triggered by electronic trading, but what individual investor was in any position to anticipate the why and when of the event? Outside of programmatic HFT traders not many people understood this market dynamic was even possible.
Parting Thoughts
Be careful. Market prices change, they change based on fundamentals, new technology and models, consumer preferences and psychology. Often times past events can be very helpful to review. There are many places to look. One can review has happened to past stock prices while in bankruptcy? In addition, a review of past unexpected technical factors can be a gauge for potential future problem. Another option is what has happened prior to past recessions? Even in doing this analysis, there are always new, unanticipated market movements. Markets are not normally distributed, and there are many factors one cannot foresee that impact prices. Individuals must consider all the above as risks and try to spot all the risk they can see and as well as the risks they know they cannot see.
Be Understanding. Individuals need to understand that they are not a loser if they miss a price change and could have made money but did not. It is always okay to not take a position because there is lack of information. In fact, knowing what position to avoid because there are many unknowns is prudent. A trade is based on the risks and opportunities that an investor can see as well as their desired risk appetite, financial position, investment horizons and goals. As individuals, many people often trade with money that has taken hours to earn in their respective profession. In trading when you take a big risk without a good reason or take a risk you do not know you are taking, there is an immediate dollar value associated with any losses. Try to spot the risks that you can see and try to minimize the risks that you cannot see. This article covered a few specific observations, some academic terms, many industry terms, and little bit of general history. Hopefully, the reader can now begin to develop their framework and mindset for investing.
Really enjoyed this article. Thanks Again. Keep writing. Eveleen Harvey Edd
thanks, very interesting 🙂